
Cancer Cell Evolution Visualization
This is the final project for CSE442: Data Visualization at the Paul G. Allen School of Computer Science & Engineering at University of Washington.
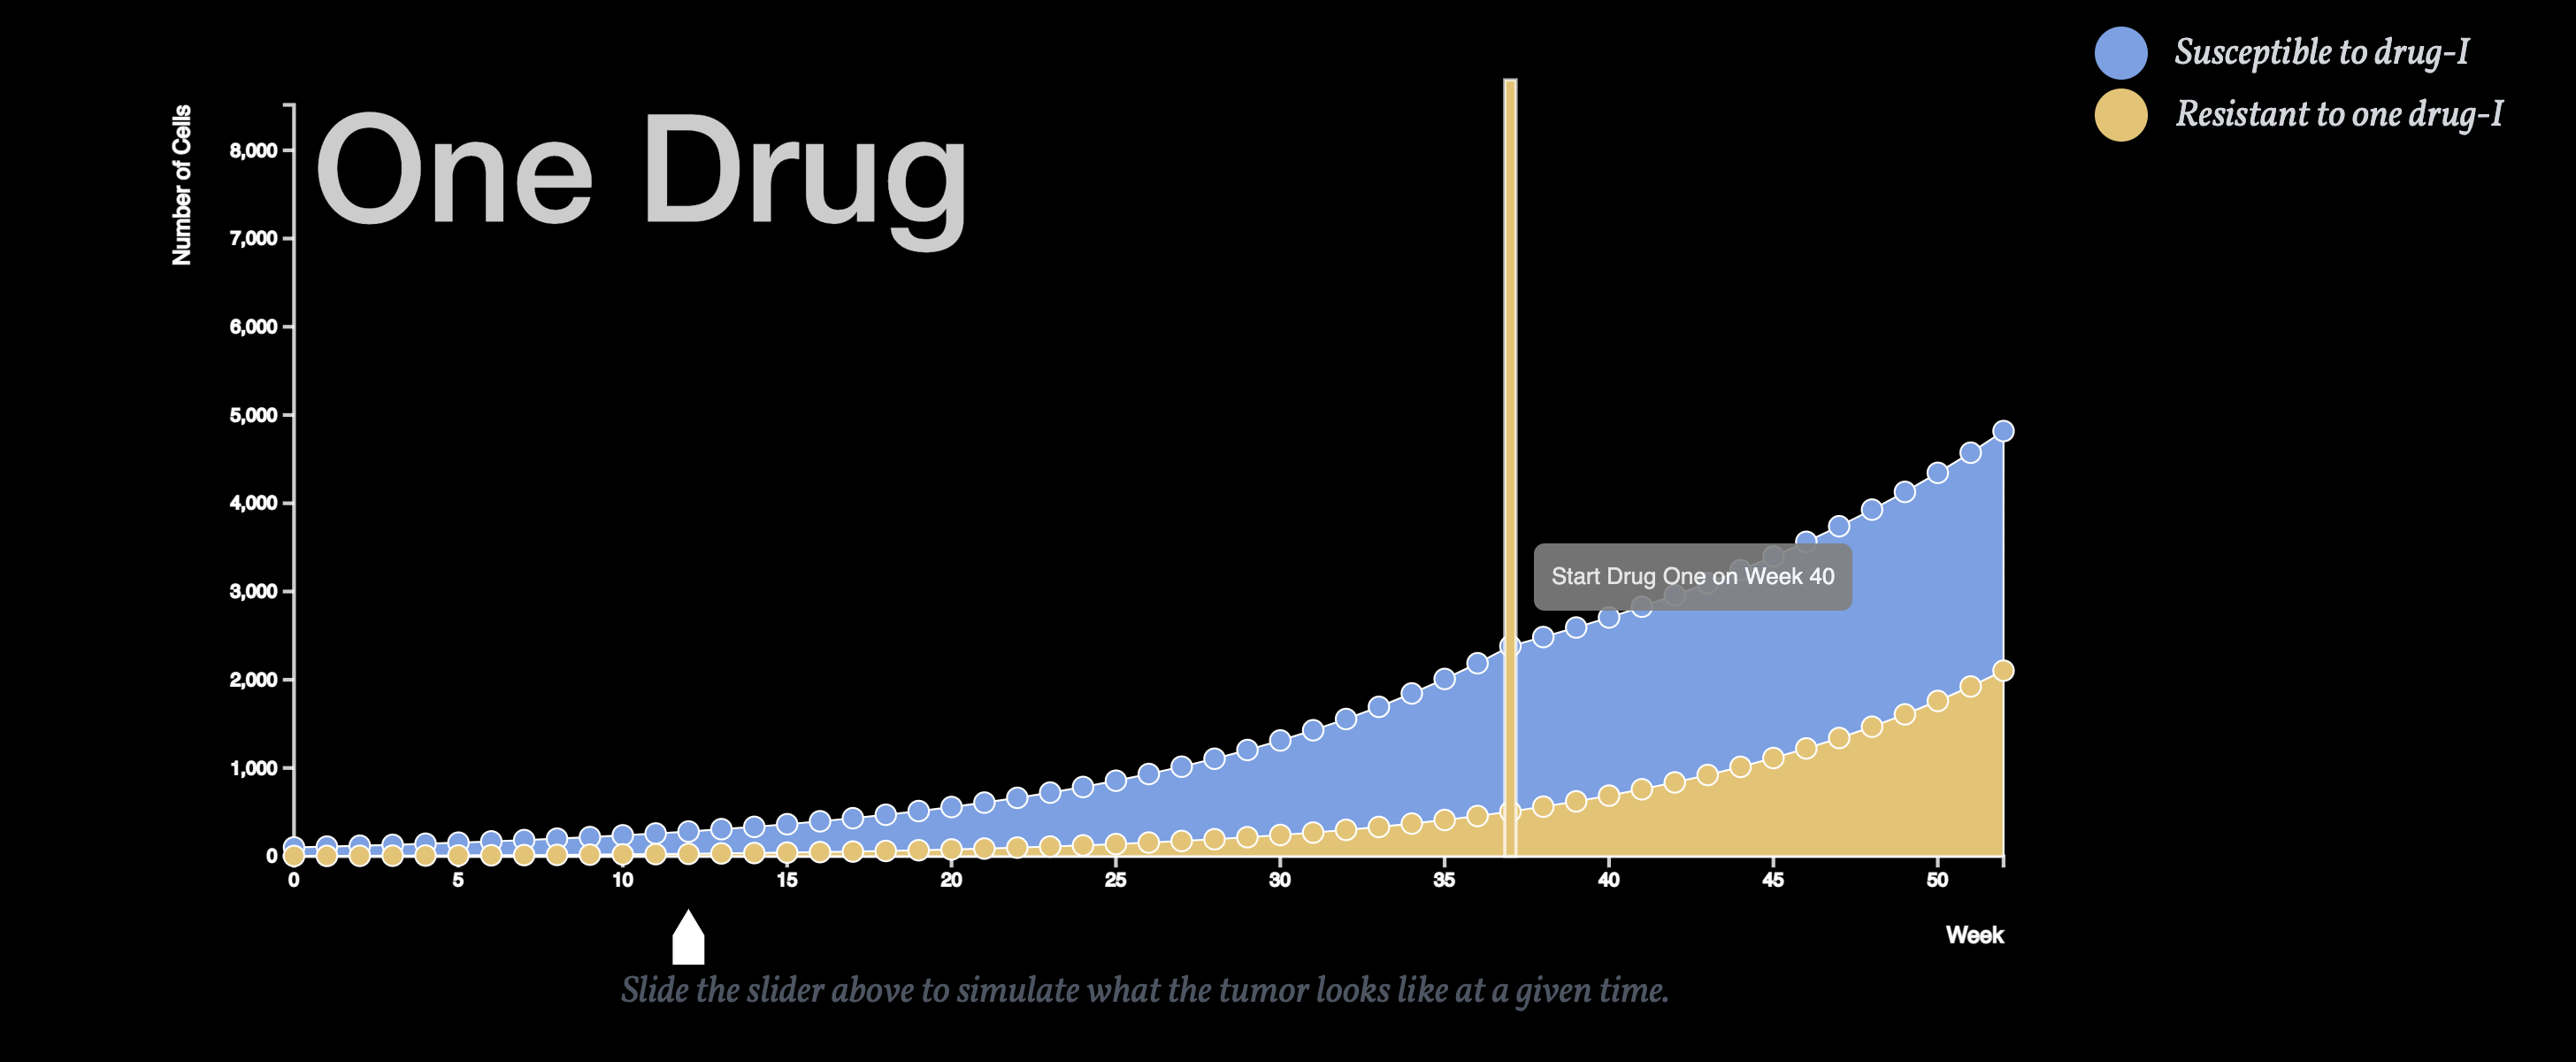
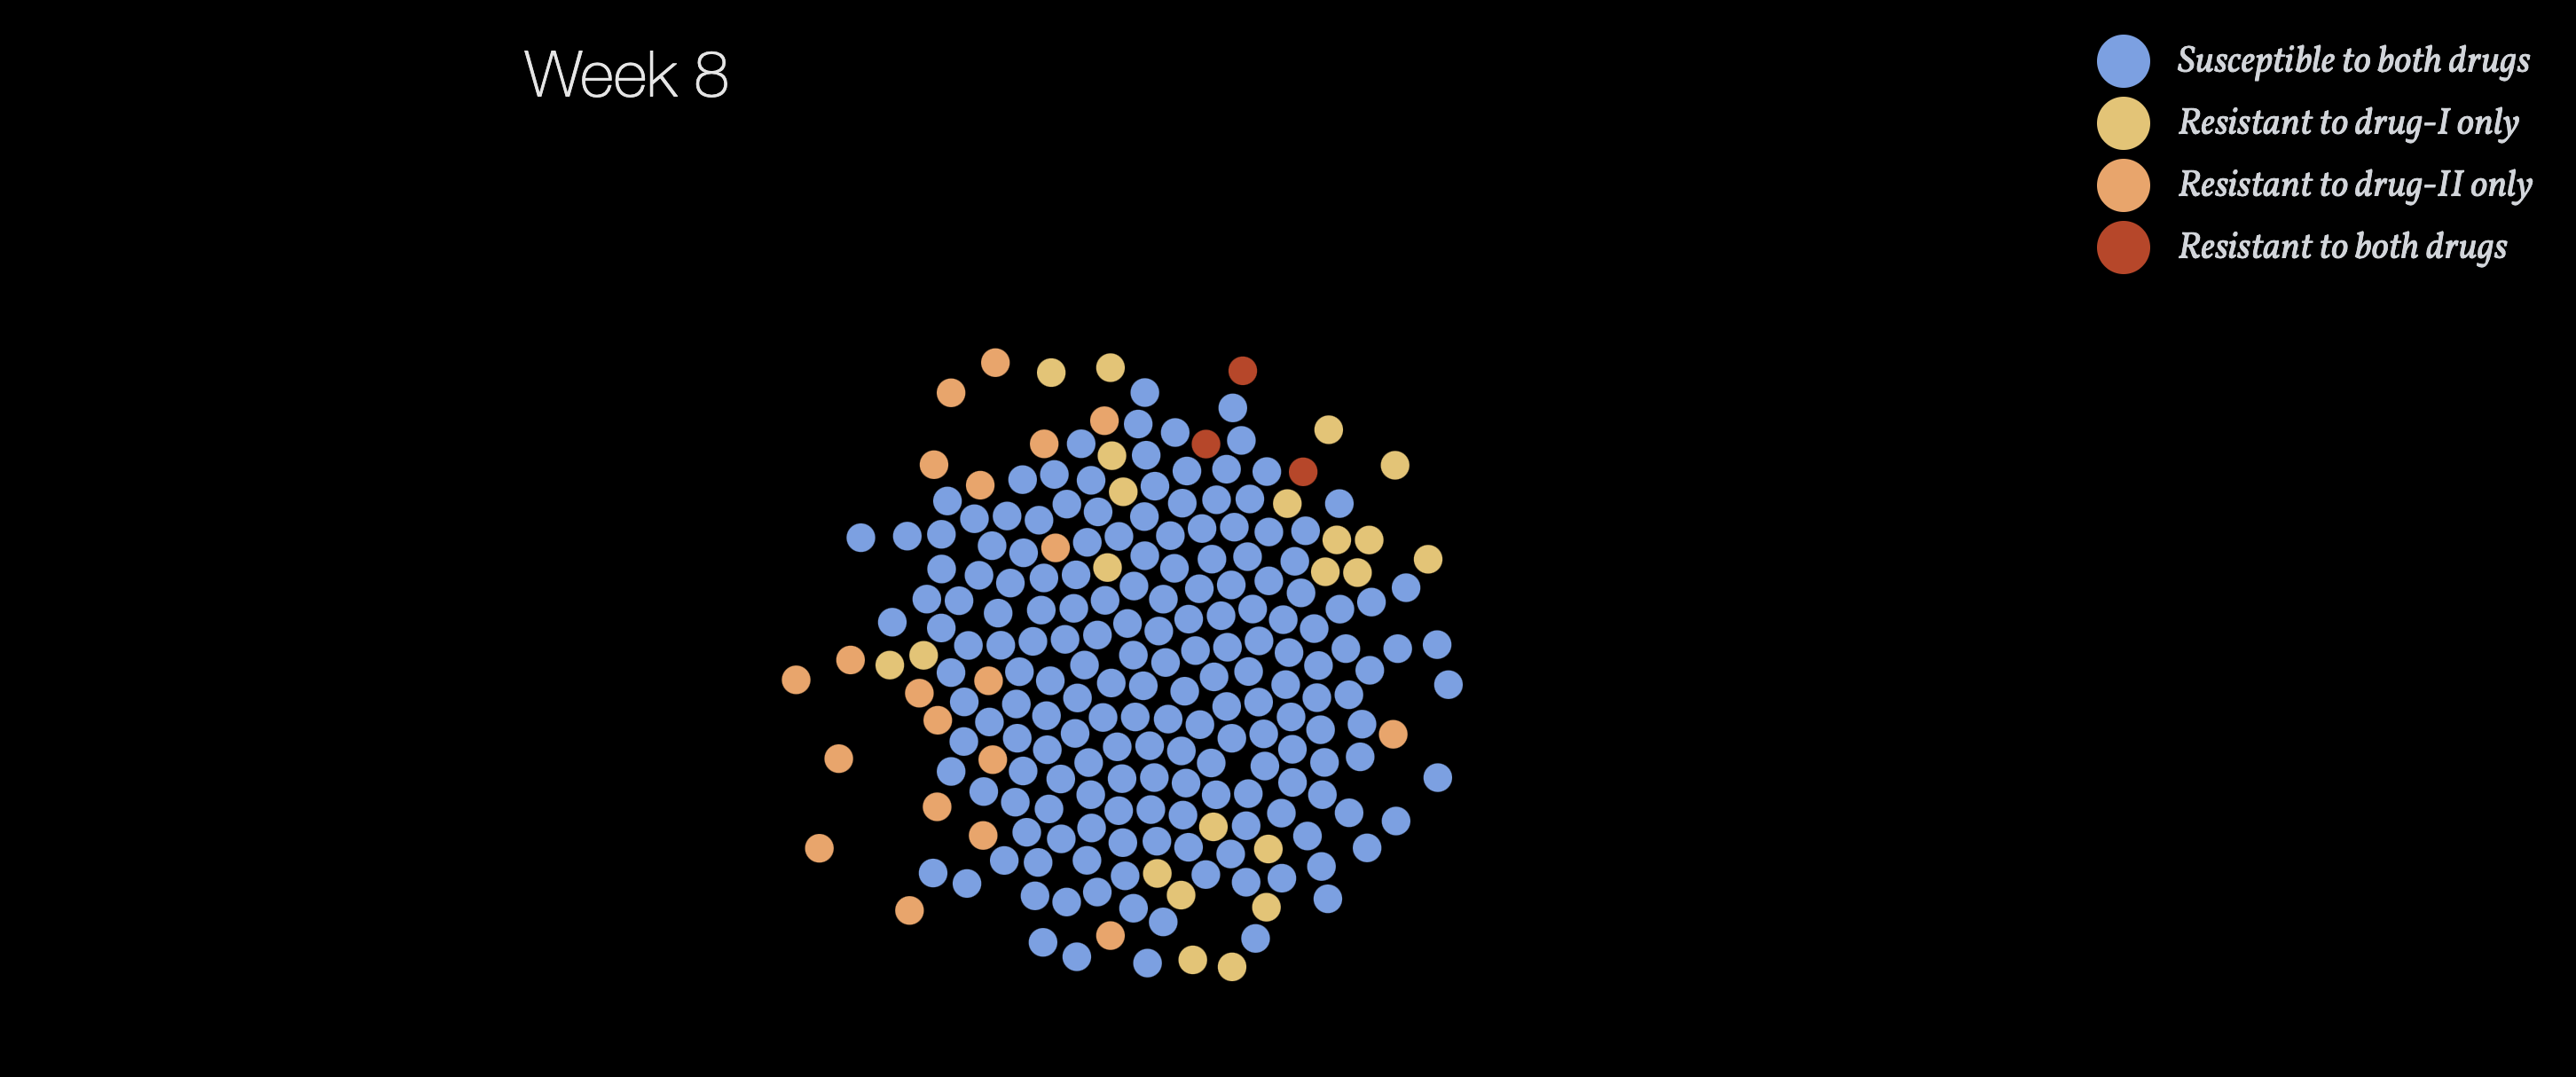
The team put the focus on one of the most challenging task in medication research: drug resistance. The idea is largely hidden under microscopes and abstract mathematical models, making itself intimidating for a lot of patients and the general audience. The team selects two scenarios under drug resistance research: drug resistance with one drug and drug resistance with two drugs. We hope the animation and visualization centering around the number of drug-susceptible cells and drug-resistant cells can help the general audience understand how drug works and how timely drug interventions can help limit cancer development.
Some screenshots of the project.
More on the visualization and the exploratory journal, check out the website.
Project also credits to Yukai Yan, Feiyou Guo and Yu Xin.